Centrality Plots
Micha Sam Brickman Raredon
2020-05-13
03 Centrality Plots.RmdThis vignette details how to use the Centrality function of Connectome.
Normalize, Scale and make connectome
panc8 <- NormalizeData(panc8)
connectome.genes <- union(Connectome::ncomms8866_human$Ligand.ApprovedSymbol,Connectome::ncomms8866_human$Receptor.ApprovedSymbol)
genes <- connectome.genes[connectome.genes %in% rownames(panc8)]
panc8 <- ScaleData(panc8,features = genes)
panc8.con <- CreateConnectome(panc8,species = 'human',min.cells.per.ident = 75,p.values = F,calculate.DOR = F)
Full system overviews
Centrality performs a series of analyses within a single integrated function. First, it takes the entire input network and filters the data based on parameters passed to FilterConnectome. Then, it subdivides the remaining network based on the group.by argument. Within each sub-network, it then performs a graph-theory-based centrality analysis, ranking each producer and receiver within the sub-network based on their cumulative outgoing and incoming edgeweight and their Kleinberg centrality scores. By default, the resulting plots are normalized over total network edgeweight so that the x-axis is fraction contribution or reception of signal within the sub-network.
We can use Centrality to immediately look at an unfiltered edgelist. Here, we use edgeweights from the normalized data slot, which are always positive:
Centrality(panc8.con,
           modes.include = NULL,
           min.z = NULL,
           weight.attribute = 'weight_norm',
           group.by = 'mode')

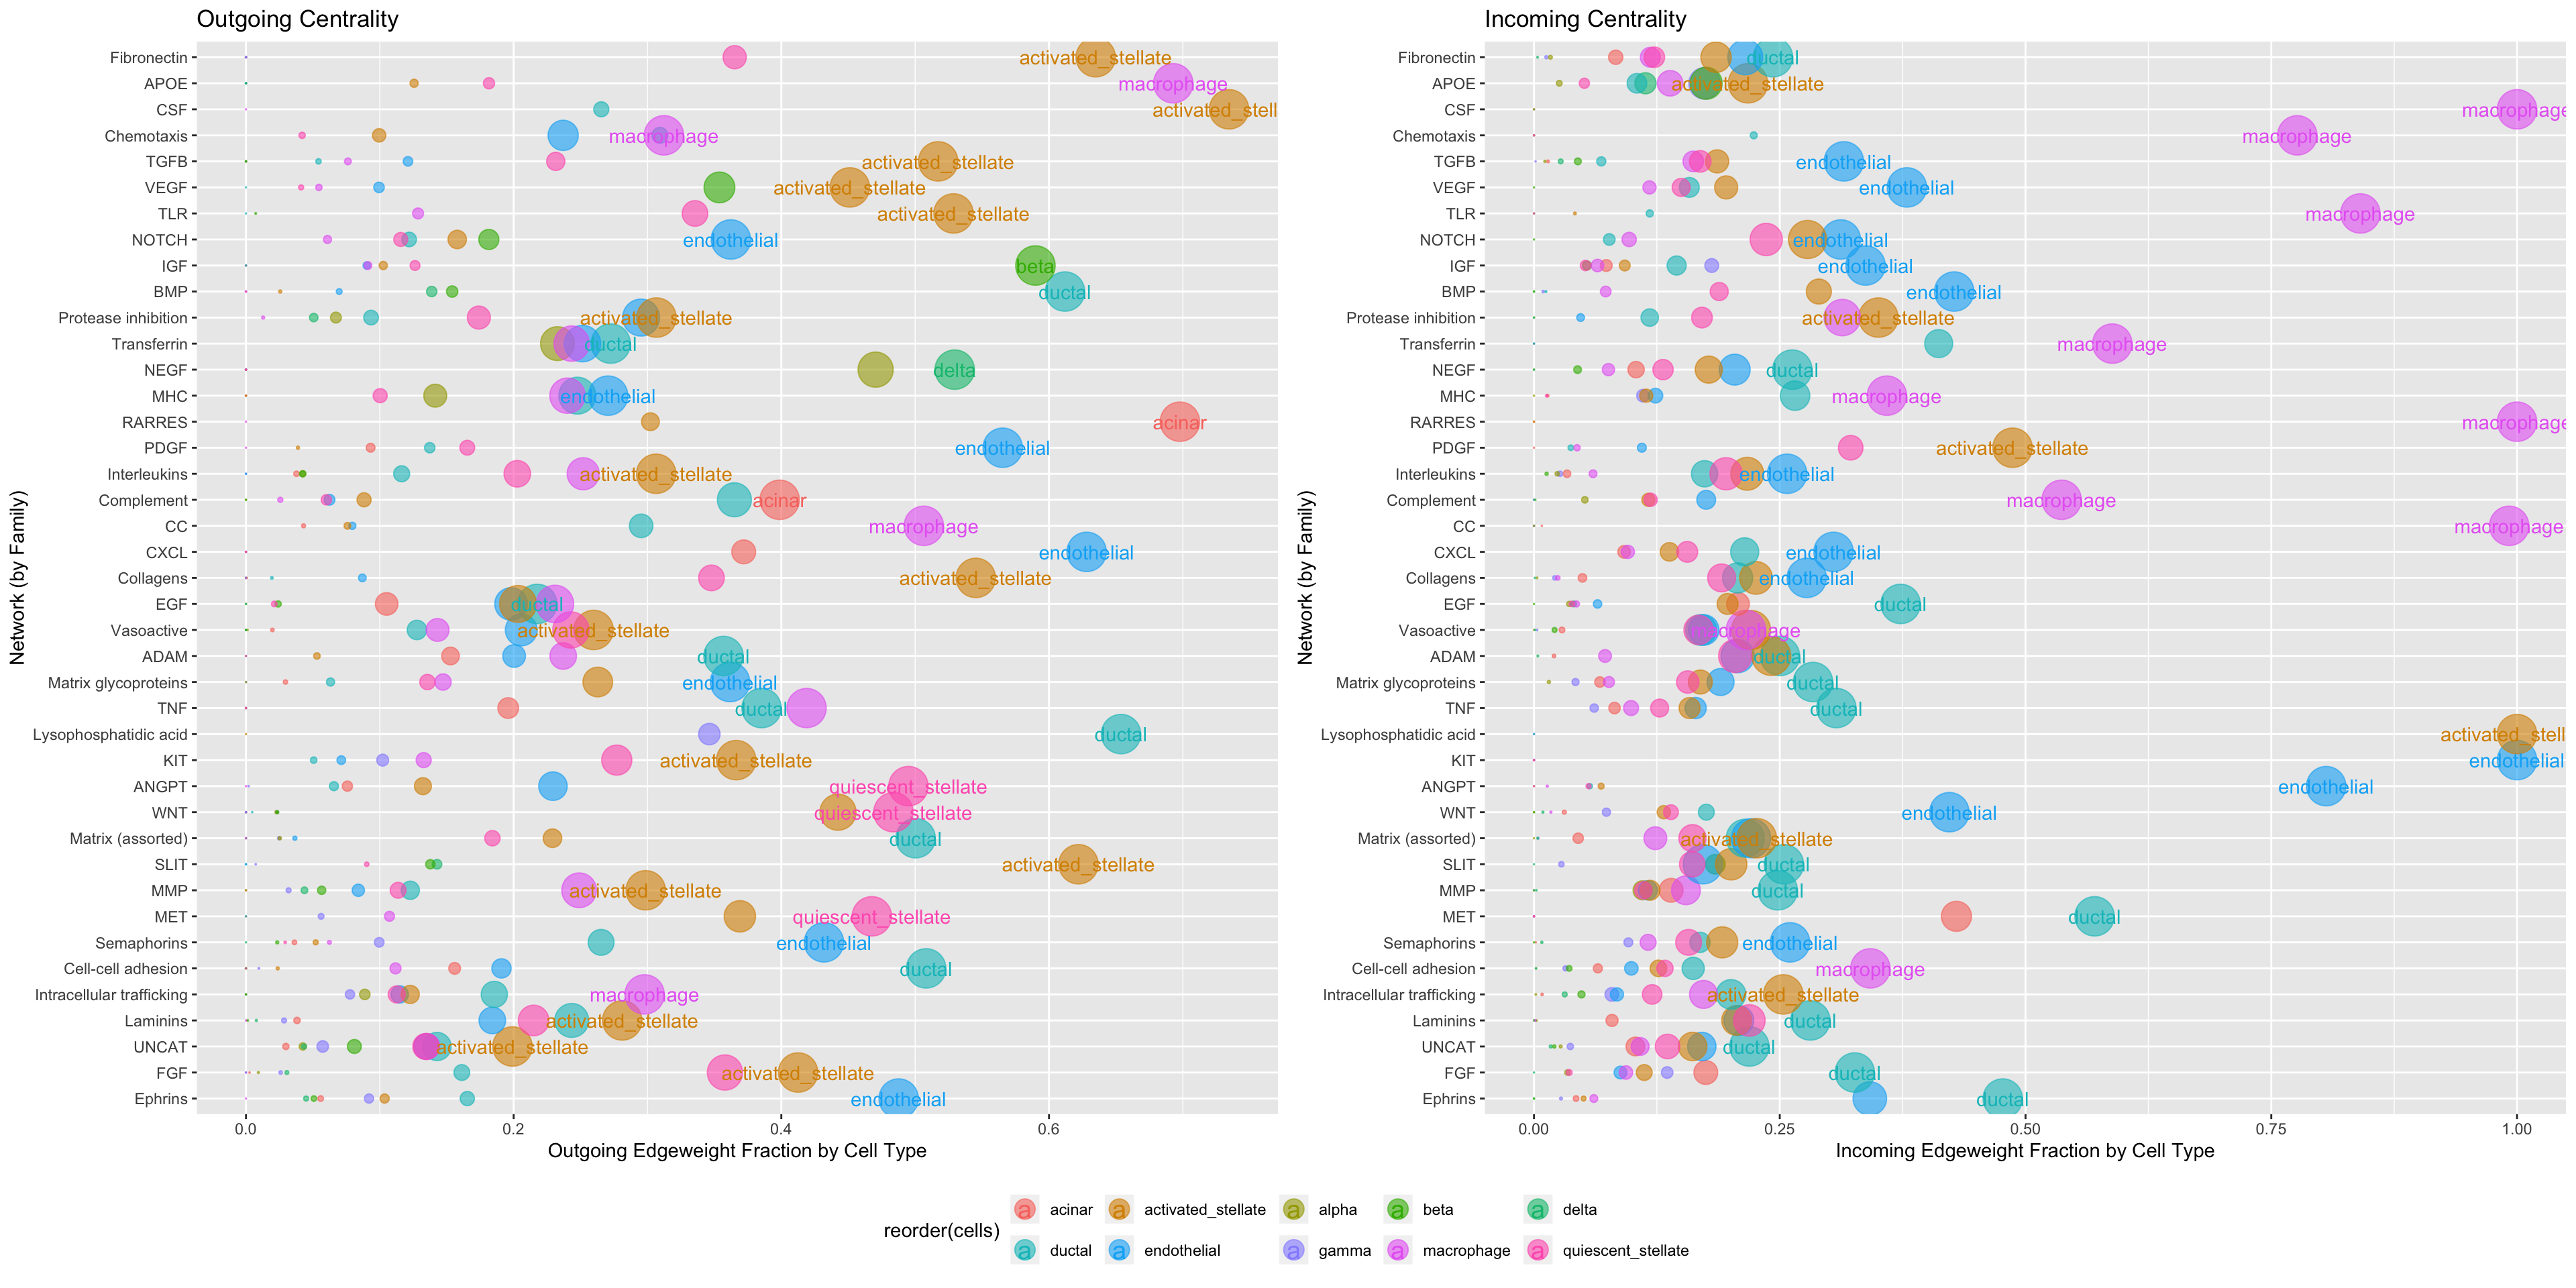
However, it is generally more informative to limit the analysis to those edges which meet a user-defined statistical threshold:
Centrality(panc8.con,
           modes.include = NULL,
           weight.attribute = 'weight_norm',
           min.z = 0.25,
           min.pct = 0.1)
Focusing on specific signaling families
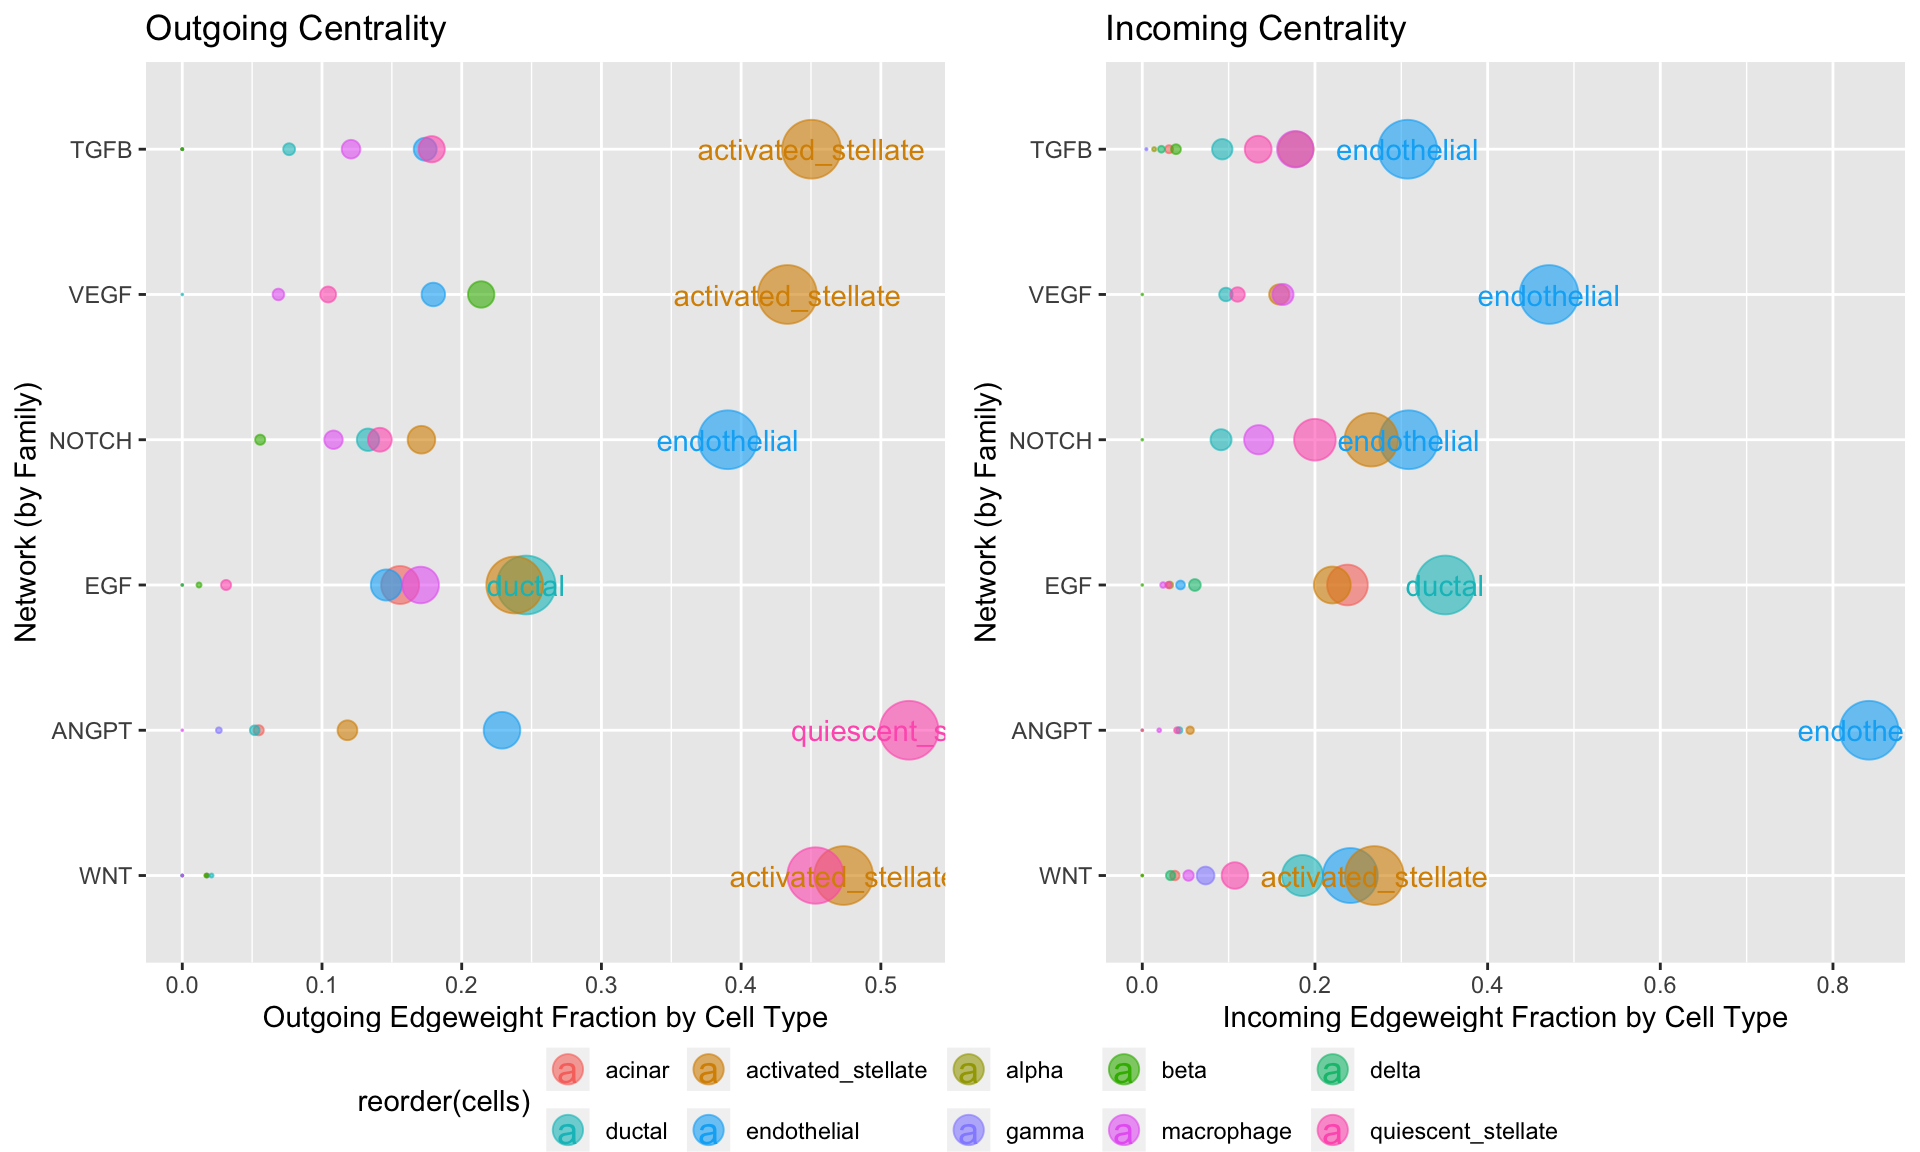
Centrality has built-in functionality to focus on specific signaling families of interest, which can help to gain a sense of which cells may be dominantly communicating via which pathways:
Centrality(panc8.con,
           modes.include = c('VEGF','NOTCH','TGFB','WNT','ANGPT','EGF'),
           weight.attribute = 'weight_sc',
           min.z = 0.25,
           min.pct = 0.1)
Breaking down a signaling family
It is important to note that a single signaling family is generally made up of multiple mechanisms, and that a ligand can hit multiple receptors and vice-versa. Therefore, it can be useful to perform centrality analysis for every single mechanism (ligand-receptor pair) present in a sub-network. Here, we do this for every mechanism in the ‘NOTCH’ family:
Centrality(panc8.con,
           modes.include = c('NOTCH'),
           weight.attribute = 'weight_norm',
           min.z = NULL,
           min.pct = 0.1,
           group.by = 'mechanism')

If only specific mechanisms are of interest, Centrality can be used to directly inquire about networks based on select genes:
temp <- subset(panc8.con,pair %in% c('TGFB1 - TGFBR1','DLL4 - NOTCH3'))
Centrality(temp,
           weight.attribute = 'weight_norm',
           min.pct = 0.1,
           group.by = 'mechanism')
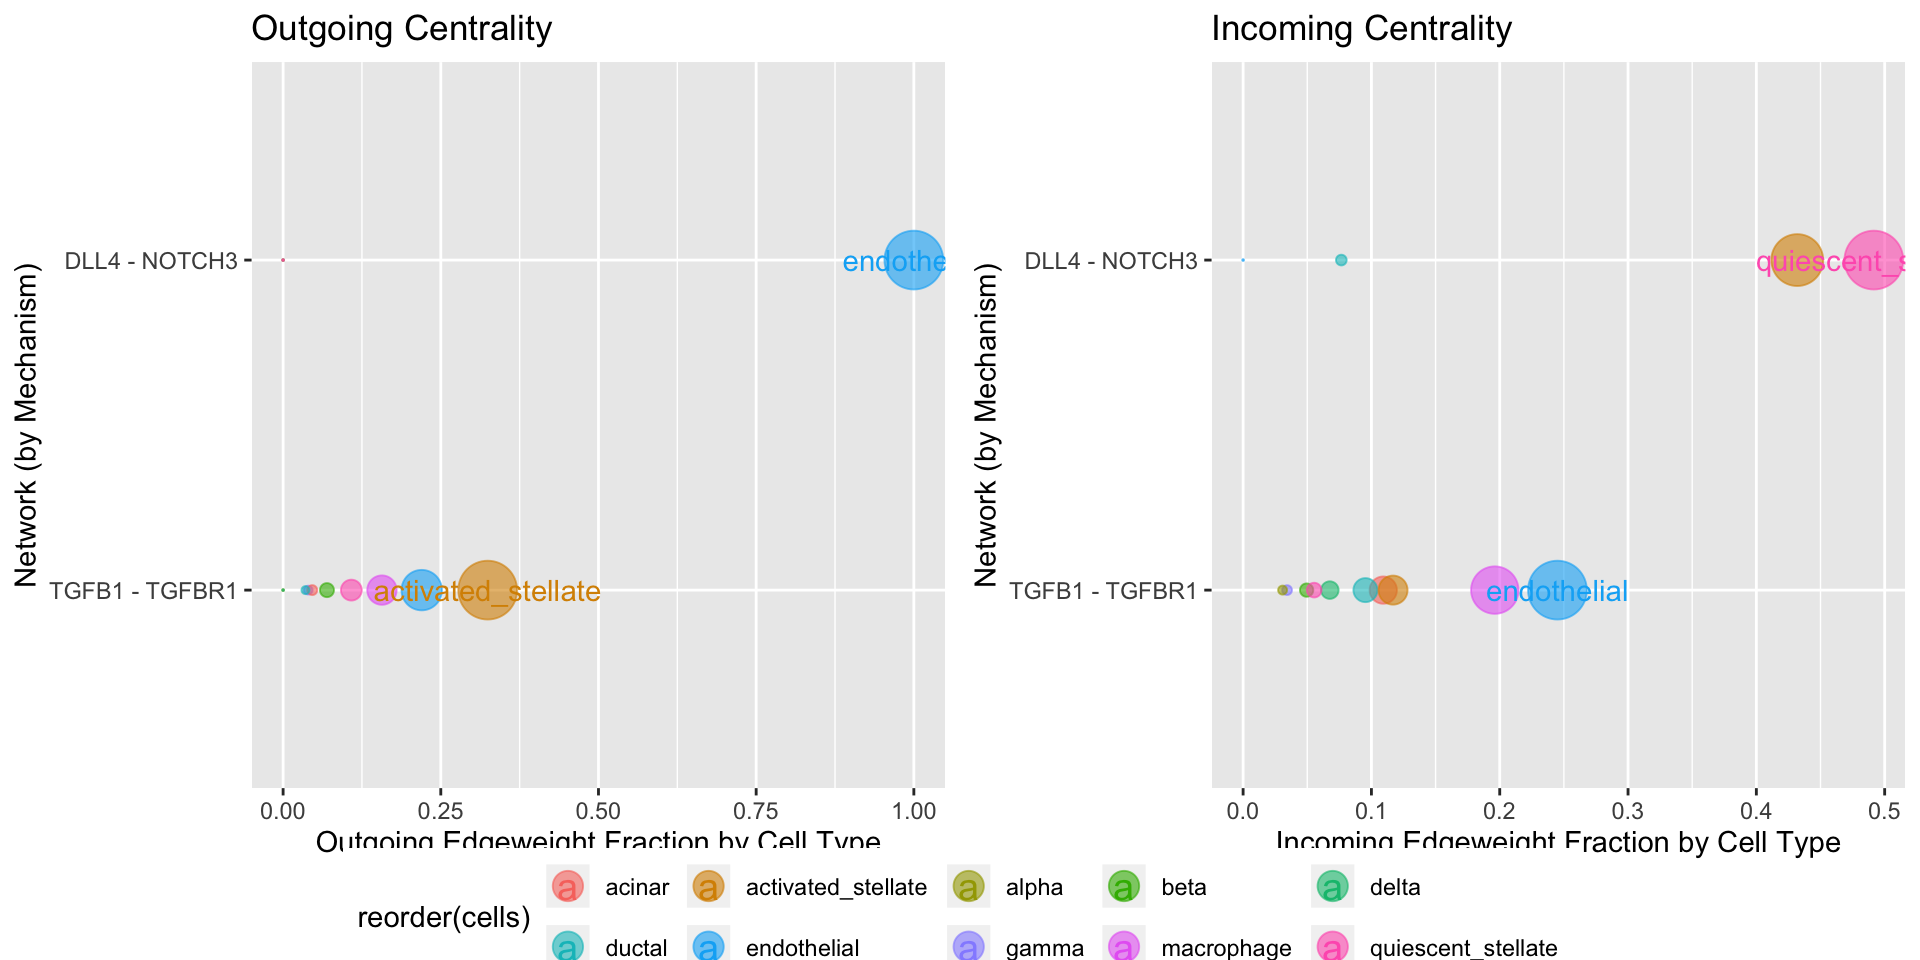
Which suggests that the TGFB1-TGFBR1 network is associated with activated_stellate -> endothelial communication, while the DLL4 - NOTCH3 network is associated with endothelial -> quiescent_stellate commmunication.